World's Simplest Data Catalogue?
June 22, 2026
This post is the fourth in a series of blogs about data several years in the making. It stands alone, so feel free to dive straight in, but if you do want to learn more about the world’s simplest data pipeline, data model or even the world’s simplest BI tool, you know where to click!
I have adopted the strategy I walk through here to create a data catalogue for my own personal data lake. You can find it here, on my github. It’s open, free and ready to use as a template, if you feel inclined.

What’s a data catalogue anyway?
Data is the lifeblood of modern business! Collecting, analysing and presenting data has become a ubiquitous pastime in every office across the world, and an ability to use data to justify decisions is now the most important skill anyone can learn. From receptionist to CEO, if you can make your point with data, you’ll do better for it.
This means that almost every business now obsesses about gathering data. Clicks, hits, customers, prospects, sales, revenue, overheads, temperature readings from sensors under every desk… hundreds of different datasets, billions upon billions of rows… from Excel spreadsheets to multi-million dollar databases in the cloud.
Gathering data is easy, cleaning it up is hard, analysing and learning from it are very difficult indeed, but the final boss of data maturity, the bit almost nobody manages to get done, is the Data Catalogue.
The concept is simple: We have a lot of data and we have a lot of people who want to use that data - all we need is a directory that tells everyone where they can find what they need. Like a phone book, or a dating app for data apps. While we’re at it, we might as well also include some other stuff, like who owns the data, how long we can keep it, where it came from, who’s allowed to access it and what tools they need to do so.
It sounds simple enough but in my experience few ever make it work. Some get by without it, lacking the time, scale or regulatory pressure to make it happen and relying on tribal knowledge to fill the gap. Others invest huge sums of money and build whole teams of people to fuss over expensive platforms and arcane processes that keep them looking busy but never really deliver what was needed in the first place.
I want to propose a different approach. One which is simple enough for any small business, scalable enough for large enterprises and straightforward enough to roll out in a matter of hours. All we have to do is get back to what we really need and why we really need it, while embracing one old and one very new technology…

Two technologies, one old and one very new
My approach to revolutionising data cataloguing is deceptively simple: Markdown Files! Yes, just basic, vanilla markdown files. You may laugh at this point because it doesn’t have enough complexity to be credible - but stick with me for a while and I’ll try to explain why, when it comes to data cataloguing, enough is as good as a feast.
A basic file-based approach makes sense in 2026 because of one old and one new technology. The old technology is Git and the new one is AI (or LLMs to be specific).
LLMs help us by redefining the term “machine readable”. There’s no need to encode the information we store in the catalogue any more, because human and machine now speak the same language. AI is what allows us to fall back on something as simple as “a collection of markdown docs”, safe in the knowledge that we can search, digest and even validate those documents in a matter of seconds, any time we need to.
The use of Git is easy to explain but unexpectedly powerful when it comes to outcomes. Pretty much every developer is familiar with Git, it’s the world’s most widely used version control system and, critically, it’s used to manage all the code that builds and consumes the datasets we’re cataloguing. It allows the management of the docs to happen ‘in the same breath’ as writing and committing the code. Same tools, same workflow.
Here’s what they look like
The documents are structured in a consistent way, but adherence to the structure is not mandatory. Convention over Configuration is very much the name of the game here. Some datasets might need additional sections and more detailed information that might not make sense to capture for others. The decision on what to capture is very much in the hands of the dataset developer. This is another way we can lower the cognitive load required to keep the docs up to date, increasing the chance that they will still be updated years from now. Our ability to use AI to trawl through the catalogue on our behalf answers any concerns we might have had about a more relaxed schema.
What’s in?
Each catalogue entry relates to one distinct dataset - a postgres database table, a CSV or Excel file, a collection of images in a cloud bucket… any single atomic collection of data. A complex database would have multiple files - more on that later.
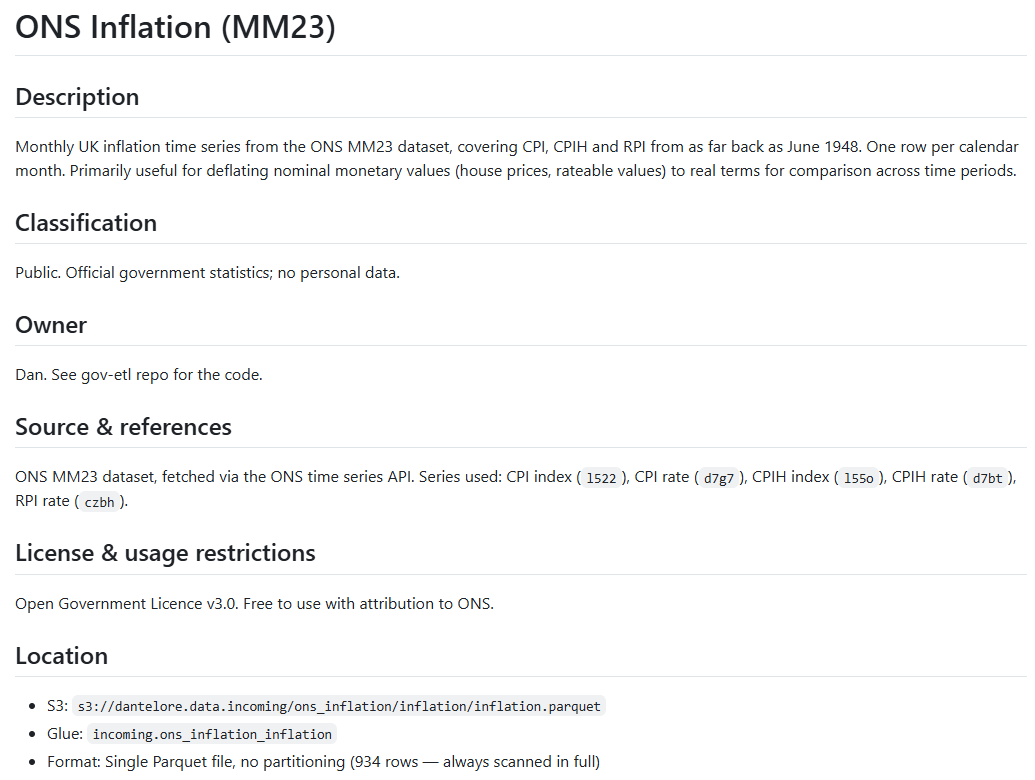
As you can see, each self-contained markdown doc contains all the obvious things you might need to know about it. Name, source, ownership, sensitivity and licensing - as well as a user-friendly description. The emphasis throughout is on a relaxed, human readable tone with all the important data captured alongside a ‘user guide’ which adds genuine value to developers and users of the dataset.
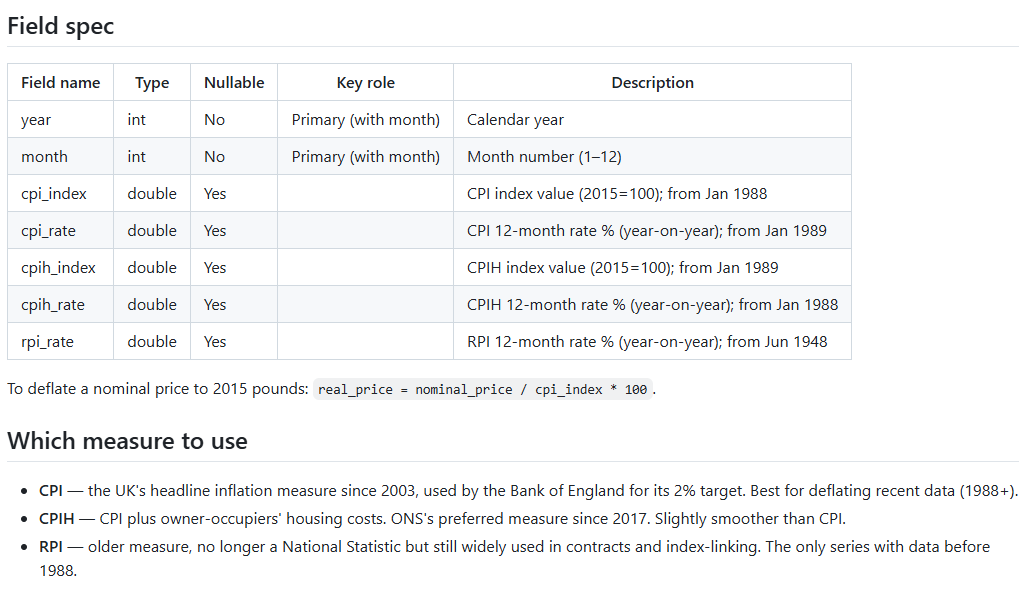
No catalogue entry would be complete without a list of fields and data types - and that’s included too. Again allowing for more columns to be added if needed. Need to track PII classification on a field-by-field basis? No problem, just add extra columns.
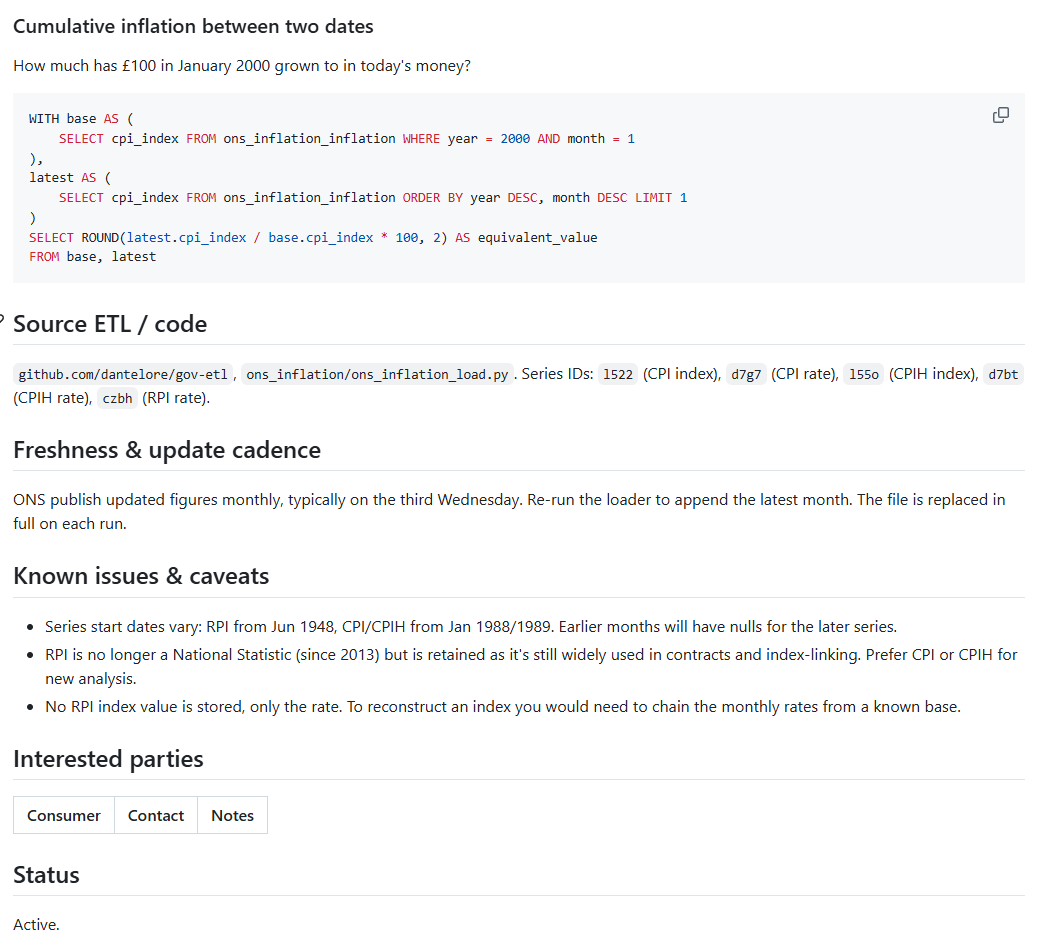
You can see a complete example here.
What’s out?
The intent here is to create the “World’s Simplest Data Catalogue”, lowering the amount of process, friction and effort it demands from users. This in turn, I believe, increases the chances that users will engage with the catalogue for years to come - ensuring genuine, functional data governance with minimal effort and cost.
The key to simplicity is not what you put in, but what you leave out. Here I propose leaving out a few things you might expect to have seen…
- One file per dataset, no central schema for the catalogue itself. Each entry self-contained; nothing to migrate when you add a new section.
- No relationship graph, no formal join modelling. A human or an AI agent can spot a plausible join from two well-written files without it being declared anywhere - there’s simply no need for the complexity that comes with tracking and defining relationships and foreign keys systematically. Rather than trying to pre-emptively design around every possible use-case, we’re trusting consumers to make sensible choices.
- “Interested parties” as a courtesy, not a contract. Consumers of a dataset can register an interest in the doc - as a flag to the dataset owner - but again this is informal and based on trust and good software development practices rather than process and restrictions.
- Git is the only version history. Not really a design choice so much as deciding not to reinvent one! Git is version history - the de facto standard for who changed what, when and why, and every dev already has it. Why have a dog and bark yourself?
- No extra tooling. A folder of text files works on day one - nothing to install, host, or pay for - and degrades gracefully: still just as readable if you abandon every other part of the convention next year.
Remember that flexibility is the aim though. If you wanted to extend the system by automating generation of parts of the files, adding CI/CD checks or anything else, you absolutely can - but only if they lower friction and improve engagement levels long term.

A folder full of datasets
OK, slightly more than one folder - actually a directory tree where each subdirectory corresponds to a logical grouping of datasets. Perhaps it’s all the Excel files maintained by the Finance team, perhaps it’s all the tables in a database, perhaps it’s organised based on the team who generate/own the data. The key thing here is flexibility.
|   README.md
+---energy-etl
|       carbon_intensity_generation.md
|       carbon_intensity_national.md
|       ...
|       README.md
|       repd.md
+---gov-etl
|       ea_lidar_1m.md
|       house_prices.md
|       ...
|       README.md
|       voa_rating_list.md
\---sales-database
    |   README.md
    +---prod
    |       customers.md
    |       orders.md
    \---test
    |       customers.md
    |       orders.md
I use git subtree - which copies one repository into a folder inside another, while still letting you pull updates down and push changes back - to add the catalogue to all my ETL repositories and anywhere else I need it. This means the docs are always there, right where I need them, right next to the code and in the scope of whatever AI agent I happen to be using. Hard to forget, easy to edit, trivial to keep up to date.
Why the simple version wins
There’s a very real chance that if you’ve made it this far, you’re feeling pretty underwhelmed by what I’m proposing. It’s no different to a wiki, right? What’s clever about this?
As I’ve said above, I believe that simplicity is what makes this effective. The two most critical questions we must ask of any data catalogue approach are “will this be kept up to date next year?” and “will this provide real value or just be an expensive white elephant?”. Complexity, bells and whistles and rigid controls decrease our chances of getting the answers we want, significantly. Small, subtle design choices here can have a huge impact:
- Storing the documentation right next to the code where it’s much harder to forget
- Using the same tools developers feel comfortable with rather than reinventing the wheel
- Flexibility to grow and change - over rigidity and inflexibility which consigns data catalogue projects to the history books as priorities change
- Informality: honesty over formality makes the docs valuable to users and manageable for contributors
- Democratises ownership - no central authority in the critical path, owning teams feel empowered, no gatekeepers or cross-team conflicts
- Coverage over completeness - designed to make contributions and updates as approachable as possible, especially where AI tools can do the heavy lifting!
All these things might feel like omissions. They are omissions! But each omission is a deliberate design choice taken to deliver our goals. Perfection is very much the enemy of good.
Let’s look at the three likely “data catalogue maturity states” in businesses today:
Level 0: Nothing to something
Most companies don’t have a data catalogue. The cost/benefit trade-off means the juice has simply not been worth the squeeze. Teams document things in their own way and for their own needs, but it’s little more than tribal knowledge really. Analysts find it easier to hoard their own data than to use anything created by another team. Compliance is based on broad claims like “there’s no PII in the data lake”.
Here we add obvious and immediate benefit, going from zero to one with minimal cost and minimal wasted time. No new tools to buy or build and thus no technology to change or extra compliance to audit. Instant gratification with a searchable, well documented catalogue that would (in my opinion at least) pass an ISO27001 audit first time round.
It took me no more than a couple of hours to roll this idea out across three different repos and 34 datasets. I immediately saw benefits (which I’ll demonstrate below). Yes, I used AI - you can too. Yes, I am working alone - but if my “couple of hours” is your “couple of days”, we’re both still winning!
Level 1: Just a wiki
The mid level here is a centralised wiki page, shared document, spreadsheet or similar. Probably managed by the resident DPO or compliance team. Entries are pulled from teams to a central place. Developers were engaged to start with but quickly drifted away as new priorities distracted them. Keeping things up to date is a constant struggle. Documents get out of date and people quickly lose faith as soon as they start getting wrong answers. A core group of committed individuals still use the data catalogue for audits, PII tracking and the like, but few others even remember it exists.
I believe we can add significant benefit here too: Changing a “pull” to a “push”, with teams actively managing their own datasets; adding genuine value to users, who appreciate the higher accuracy and faster pace of updates; fewer tools, lower complexity and a decreased workload for the long-suffering DPO!
This is a major cultural shift for a business on the middle tier, hopefully with lasting benefits.
Level 2: Big, expensive white elephant
The “top tier” data catalogue is likely only found in the largest or most highly regulated environments. Governments, big banks and the like, using sprawling and costly tools like Collibra, Alation, Informatica or Microsoft Purview. Heavyweight prescriptive tools which model every element of every dataset with strict rules and overbearing process. These tools do everything I decided not to and more. They are the brute force behemoths of data governance.
I’m not going to lie, it’s going to be pretty hard to convince anyone using these tools to ditch them for a lightweight, democratised solution based on conventions and flexibility alone. The complexity, cost and sheer weight of these tools lends them credibility - makes them sound “serious”.
BUT…
These businesses will have a harder time reaping the benefits of their data with AI tools. Integration will be slow and costly. They will be less agile, they’ll duplicate more work and pay a vastly higher price for a higher (perceived) level of control over their data.
I’m not alone in spotting the issues for these big players though. Gartner state that “Current data governance practices are often too rigid and insensitive to the business context” and that “By 2027, 60% of organizations will fail to realize the anticipated value of their AI use cases due to incohesive data governance frameworks”.
AI will improve efficiency is the mantra today, but it’s only true if you let it happen. The structured, heavyweight approach existed because machines couldn’t read anything else - and that reason has just evaporated. AI doesn’t make complexity efficient, it makes it unnecessary. Will these big organisations be brave enough to embrace “easy”?
Does it actually work?
Yes it does! To illustrate this, I imported the catalogue repo to my website project and gave Claude Code the following prompt, it managed to pull together the graph I needed with no further questions or clarifications.
I have just added my data catalogue repo to this project (see the 'catalogue' directory), which describes all the datasets in my personal data lake.

Using that metadata and the query functionality added to this project (see the 'charts' folder), add a new chart to the 'simplest-data-catalogue.md' post showing inflation adjusted oil price as a line chart - covering as much time as we have data for.
The sharp-eyed reader might spot that adjusting a dollar-denominated oil price by UK inflation is a strange thing to do (at least without converting to GBP first) - but the aim here was to see if the catalogue gave me a view of the data available - as a consumer of the data, it’s my responsibility to use it wisely!
If you’re interested in how I made the charts work, see the previous instalment in this blog series.
Make it your own
So hopefully by now I’ve convinced you that simplicity and utility are the key success factors for a good data catalogue, and that you shouldn’t fall for the false premise that complexity and cost mean value.
I’ve shown you how it works, where you can use it and how I’ve used it myself. The only thing left to say is: now take it away and make it yours! Clone the repo, add your own datasets, tweak the format if you like and you could have a solid data catalogue set up for your team by the end of the day!