A Trip to the Movies
November 6, 2018
Well… this post isn’t really about movies, it’s more about how I spent the last week or so brushing up my data manipulation skills using python, matplotlib, numpy, pandas, seaborn and the fantastic Google Colaboratory. But I did learn some interesting things about Stan Lee in the process…
Google Colaboratory is a python notebook within Google Docs. So it has all the features you’d expect from a vanilla notebook like jupyter (on which I think it is based) but you also get the online, shared editing, live update experience you’d get with Google Sheets and the like. When you fire up the notebook, it’s attached to a ‘blank’ debian instance, running somewhere in the cloud. You can install all the tools and libraries you like, then jump straight into python code. Review: 5 stars! Would recommend.
You can find all the code and charts for this article on this shared colab notebook.
What’s the Story?
The movie data I downloaded is linked to a kaggle challenge to predict profitability. I started off with some basic investigation of the covariance and correlation of various fields. I soon got bored though - there’s not really any field in the dataset that helps predict the profit a movie makes. I guess that’s why it’s a challenge… but I was here to play with charts, not machine learning.
So, I started to look at the cast:
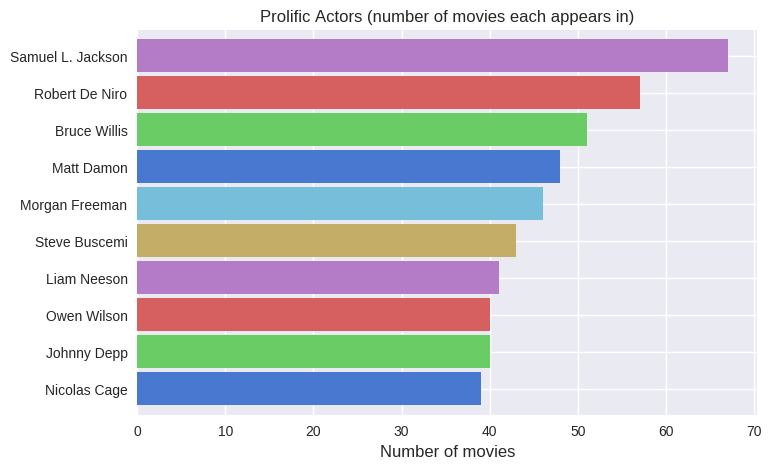
Samuel L Jackson appears in the highest number of movies in the dataset, followed by a constellation of… embarrassingly male stars.
Being in a large number of films doesn’t imply you’re a great actor, or a sure fire sign of sky-high profits. Each actor has their own unique spread of profits from the various films they’ve been in. Below I compare three actors with the power of histograms.
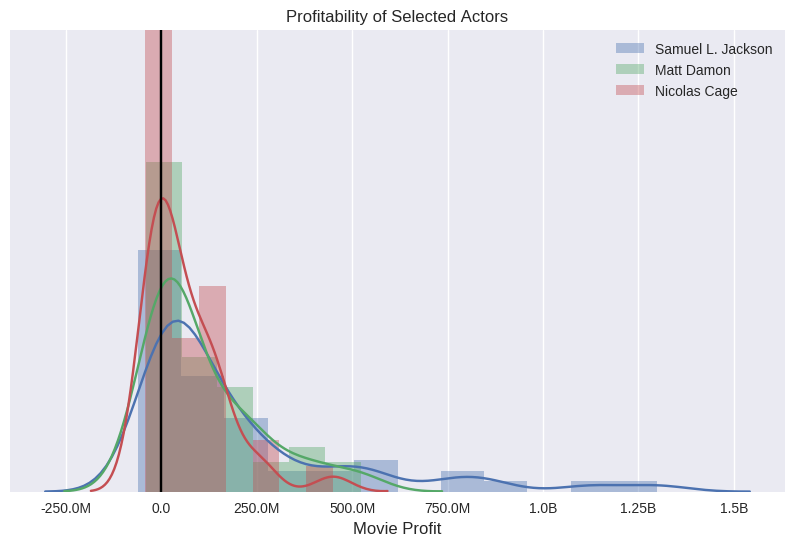
This chart is a bit busy, but having categorised the movies by the amount of profit they made, the bars show the proportion of movies in that category for a given actor. Simply put, having bigger bars on the right hand side is good. SLJ has a healthy spread, way over a billion dollars in some cases. Nick Cage is doing the worst of the three, with no movies over the half-billion mark and a big spike right on zero.
NOTE: The y axis in this histogram (and those which follow) is normalised to run from 0..1 so we can compare the spread of data for each actor, without being biased by the number of movies they've made.
Let’s look at the total profit made by films each actor has been in…
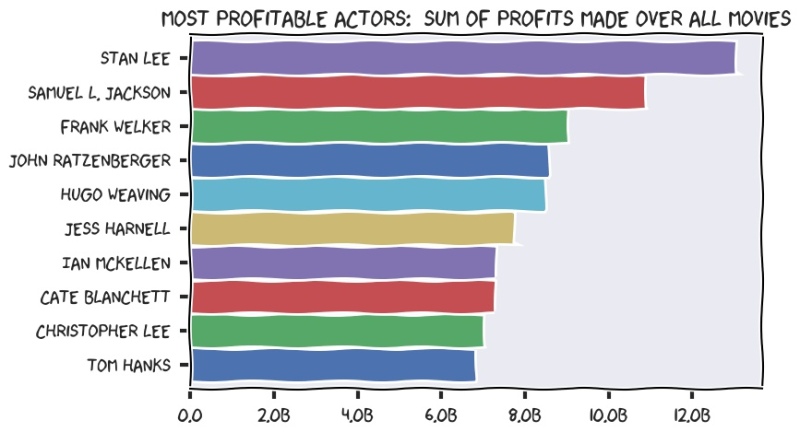
The observant will notice that the above chart looks much like the comics of Randall Munroe. This is because matplotlib has built-in support for XKCD styles. Yes, it really does! I genuinely think this second horizontal bar chart is *much* more engaging than the one higher up the page.
Two key things to note here - first, and thanks almost entirely to the Lord of the Rings trilogy, there is finally a woman on the list. Secondly, Stan Lee shot right to the top, he’s appeared in films totalling an unbelievable $13billion. That’s the GDP of Albania!
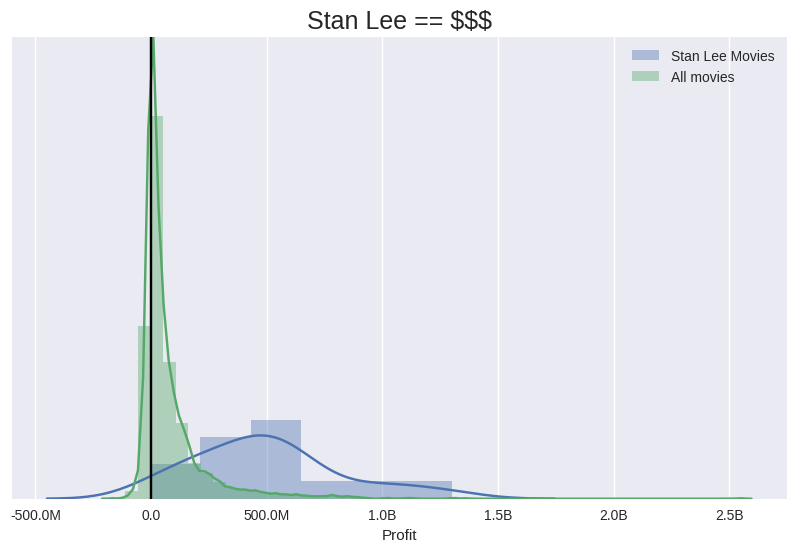
Looking at the profit distribution of Stan Lee films vs ‘all films’ it’s clear that he’s a sure sign of a large payday. He’s never appeared in a film that made a loss and he’s generally to be found in the half-billion zone. For context, compare this to your average film, which is more than likely going to make just a few tens of millions on average.
Stan normally crops up in Super Hero movies. Specifically movies based on comics, I guess. It’s hard to find these in the dataset, they are categorised as “Action”, “Sci-Fi” and so on; there’s no specific genre for heroes. However, in the keyword field there are movies tagged “Marvel Comic” which helps us. Pulling these out, we find that Stan doesn’t appear in every one…
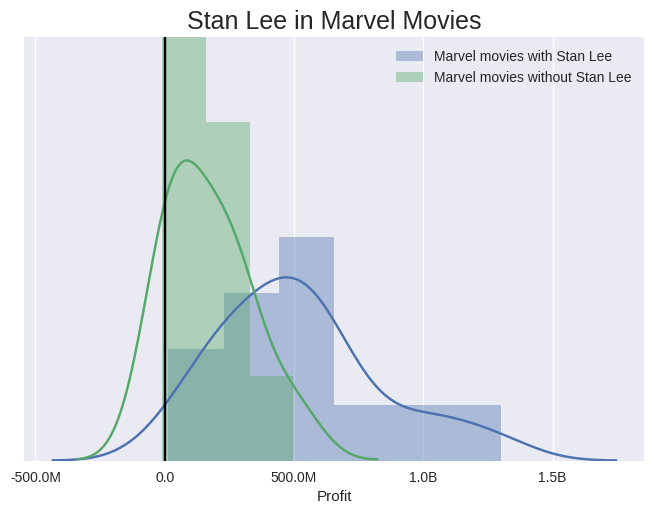
So two key learnings here: Marvel Comic movies consistently make money… and those which Stan Lee chooses to appear in make around a billion more on average!
So…
I’m not really sure what I set out to prove here. But I guess what I did was…
- Demonstrate some tools to analyse and explore a dataset - remember to check out the Colab link for more code, charts and ramblings
- Create a cut-and-paste nirvana for various pandas and matplotlib tricks (see the above link)
- Find out that Stan Lee is more effective than the whole of Albania, when it comes to making money
- Draw some pretty charts
Maybe four things is enough for any blog post? :)