TFS Dashboard Fun
November 24, 2012
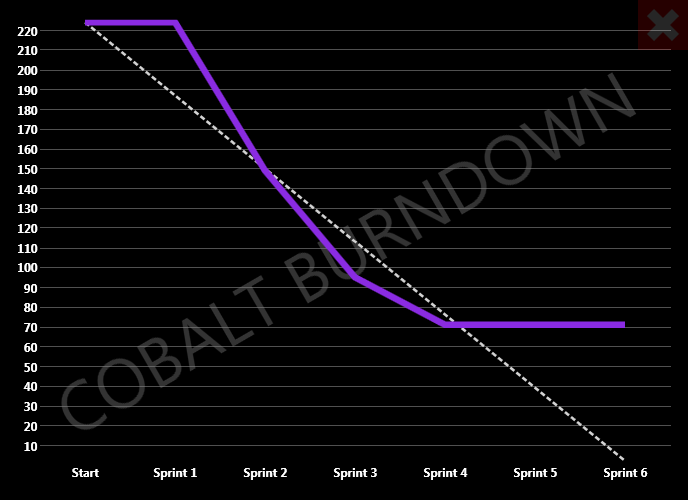
It turns out it’s really quite simple to get data out of Team Foundation Server. You can do it using the built-in reporting tools, but that seems a bit boring to me. After the Big Cheese agreed to buy us a super-sized telly to get some project propaganda into the office I decided to whack out a WPF app.
Three useful bits of information worth recording here. How to get information out of TFS, how to draw nice looking graphs and how to make a borderless, click-anywhere-drag style app without the windows title bar.
Getting Information From TFS
I’m not going to go into huge depth on how I structured by queries as everyone uses TFS slightly differently. If you’ve got the smarts to knock up some TFS queries - and if you don’t you might need to learn anyway - then you should be good to go with these code snippets.
Get a list of sprints (iterations). This one was a bit tricky and took some time to work out!
        [Test]
        public void CanGetListOfSprints()
        {
            var tpc = new TfsTeamProjectCollection(tfsUri);
            var workItemStore = (WorkItemStore)tpc.GetService(typeof(WorkItemStore));

            IEnumerable<string> names =
                from Node node in workItemStore.Projects[projectName].IterationRootNodes[releaseName].ChildNodes
                select node.Name;

            Assert.That(names, Is.Not.Empty);
        }
Get a list of stories waiting for signoff by product managers.
        [Test]
        public void CanGetStoriesAwaitingProductManagerSignoff()
        {
            var tpc = new TfsTeamProjectCollection(tfsUri);
            var workItemStore = (WorkItemStore)tpc.GetService(typeof(WorkItemStore));

            StringBuilder queryText = new StringBuilder();
            queryText.AppendLine(@"Select [ID], [Title]");
            queryText.AppendLine(@"From WorkItems");
            queryText.AppendLine(@"Where");
            queryText.AppendFormat(" [Team Project] = '{0}'\n", projectName);
            queryText.AppendLine(@"And");
            queryText.AppendLine(@" [Work Item Type] = 'Product Backlog Item'");
            queryText.AppendLine(@"And");
            queryText.AppendFormat(" [Iteration Path] under '{0}\\{1}'\n", projectName, releaseName);
            queryText.AppendLine(@"And");
            queryText.AppendLine(@" [State] = 'Committed'");
            queryText.AppendLine(@"And");
            queryText.AppendFormat(@" [Assigned To] in ( {0} )", productManagers);

            IEnumerable<string> workItemNames = from WorkItem wi in workItemStore.Query(queryText.ToString())
                                                select wi.Title;

            Assert.That(workItemNames, Is.Not.Empty);
        }
WPF Line Charts
For the charts I used the WPF toolkit. It’s not seen much development in recent years but it’s still an easy and quick way to get a chart on screen. Here are some XAML snippets.
Here’s the chart itself. Two line series here. You select the ItemsSource: list of objects corresponding to points on the line; DependentValuePath: name of a property on the object to use as the value for the Y axis; IndependentValuePath: value/label for the X axis.
            <chart:Chart x:Name="TheChart" Width="1024" Height="728" Foreground="White" FontWeight="Bold" FontSize="18"
                         Template="{StaticResource ChartTemplate}"
                         LegendStyle="{StaticResource InvisibleStyle}" >
                <chart:LineSeries DependentValuePath="ProjectedBurndown" Foreground="White" IndependentValuePath="SprintName" ItemsSource="{Binding Sprints}" IsSelectionEnabled="False"
                               PolylineStyle="{StaticResource ProjectedLineStyle}" DataPointStyle="{StaticResource ProjectedDataPointStyle}"/>
                <chart:LineSeries DependentValuePath="ActualBurndown" IndependentValuePath="SprintName" ItemsSource="{Binding Sprints}" IsSelectionEnabled="False"
                               PolylineStyle="{StaticResource ActualLineStyle}" DataPointStyle="{StaticResource ActualDataPointStyle}"/>
            </chart:Chart>
This one is used to hide the legend:
        <Style x:Key="InvisibleStyle" TargetType="Control">
            <Setter Property="Width" Value="0" />
        </Style>
Control Template to give better control over the look of the chart area:
        <ControlTemplate TargetType="chart:Chart" x:Key="ChartTemplate">
            <Border Background="{TemplateBinding Background}" BorderBrush="{TemplateBinding BorderBrush}"
                    BorderThickness="{TemplateBinding BorderThickness}" Padding="{TemplateBinding Padding}">
                <Grid>
                    <primitives:EdgePanel x:Name="ChartArea" Style="{TemplateBinding ChartAreaStyle}">
                        <Grid Canvas.ZIndex="-1" Style="{StaticResource PlotAreaStyle}" />
                    </primitives:EdgePanel>
                </Grid>
            </Border>
        </ControlTemplate>
Two styles needed to render the lines with no data points and custom colour etc:
        <Style x:Key="ProjectedDataPointStyle" TargetType="Control">
            <Setter Property="Width" Value="0" />
            <Setter Property="Background" Value="LightGray"/>
        </Style>
        <Style TargetType="Polyline" x:Key="ProjectedLineStyle">
            <Setter Property="StrokeThickness" Value="4"/>
            <Setter Property="StrokeDashArray" Value="2,1"/>
        </Style>
Borderless Click-Drag
This last one was insanely simple but I don’t want to forget, so here it is. All code is in MainWindow.xaml. Adding these few lines gives you an app with no border that can be dragged by clicking and dragging anywhere. I also added a double-click-to-toggle-maximised-state feature. Use Viewboxes libreally in your XAML to make it look nice!
public partial class MainWindow
    {
        public MainWindow()
        {
            DataContext = new BurndownViewModel(new Uri("http://whatnot/tfs/thingy"));

            InitializeComponent();

            MouseLeftButtonDown += StartDragMove;
            MouseDoubleClick += ToggleWindowState;
        }

        private void ToggleWindowState(object sender, MouseButtonEventArgs e)
        {
            WindowState = (WindowState == WindowState.Maximized) ? WindowState.Normal : WindowState.Maximized;
        }

        private void StartDragMove(object sender, MouseButtonEventArgs e)
        {
            DragMove();
        }

        private void CloseButtonClicked(object sender, RoutedEventArgs e)
        {
            Close();
        }
    }
