The Data Compass: How to Build a Data Strategy
November 10, 2022
Over the past few years I’ve been lucky enough to be able to play a role in defining the Data Strategy for a number of businesses. Over that time, and through a mixture of trial and error, research, wonderful mentors and teamwork I’ve developed what I feel is a good model for building a data strategy for any business. I’m going to document my thoughts on the subject here, in the hope that it’s helpful for others, or just a good jumping off point for debate and discussion.

Why do I need a data strategy anyway?
All businesses use data. From huge data players like Google and Facebook to your local plumber, it’s impossible to run a business without data. It could be as simple as just company accounts or Trustpilot reviews. For larger online businesses analytics data is often at the core: customer behaviour, segmentation, ad revenue and performance data and so on. All companies store data about their customers and employees which must be stored and utilised respectfully, in line with legal and ethical standards.
Just as data is everywhere, there’s also a smorgasbord of ways to derive value from that data. Better forecasting, optimised advertising, a deeper understanding of customers, and of course a host of unique data-driven products which could form the backbone of your entire business. What is the right level of ambition for you? Are you planning to utilise machine learning and AI? How accurate is your source data, and how can you be sure? How much are you willing to invest, and for what reward?
Having a data strategy is simply a way of being deliberate about how and why your business engages with data. Recording your decisions on the data you collect, the tech used to secure and manage it, the people who have access to it and the ways you want to use it to provide services, optimise work and ultimately make money. A good data strategy also provides a call to action for employees, as well as guardrails within which they can work.
As unique as you are…
This might seem really obvious, especially if you’re somebody who works with strategy all the time, but I do think it’s worth stating very clearly for the avoidance of doubt: Data Strategies are all different. And I don’t just mean the specific content within some pre-defined framework; the selections made from some standard multiple-choice questionnaire… It’s much more than that. Everything is different. The questions you set out to answer, the level at which you pitch, the scope of the policies and the people involved must be unique to your organisation, your goals and your circumstances.

Because every strategy is different, maybe it’s foolish to think that there could be a re-usable methodology that works ubiquitously out of the box. Nevertheless, I do think it’s possible to define a sort of meta-framework to think about this and make sure the right questions are being asked and answered. Interested? Read on!
The Data Compass
Data means many things to many people. Sometimes it’s a commodity, sometimes it’s a team, sometimes a skillset. If you’ve worked for a large company with a fair amount of data, you’ll have met a whole host of data people from Analysts and Data Scientists to Data Engineers, Data Ops, DBAs as well as data savvy marketeers, people analysts, finance analysts… the list goes on.
Each of these people will engage with data in a different way, have different needs and different success factors. The Data Compass is a framework I first used to structure data teams, but have extended to address each of these different, and often competing interests when defining a data strategy. It’s called the Data Compass because there are four key focus areas, each of which pulls in a different direction - simply drawing these topics as arrows helps illustrate the healthy tension between them…
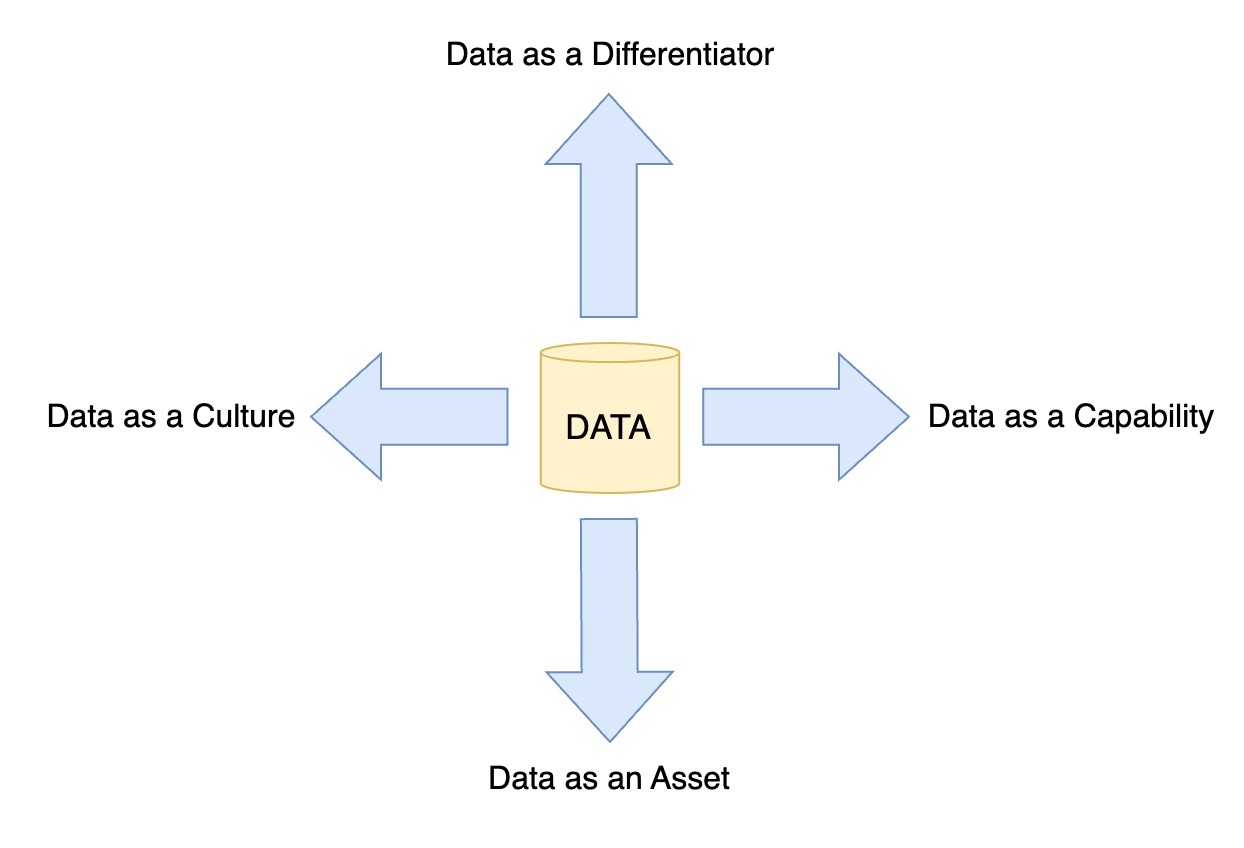
Data as a Differentiator
How will your data products help you deliver value to customers and stand out from the competition?
Perhaps you’ll use machine learning models to add value over and above ‘raw’ data, turning a measurement into a recommendation. Perhaps you’ll act as an aggregator, pulling data from many sources to give your customers the best possible choice. Perhaps you’ll provide tailored recommendations to your users, modelling their behaviour and predicting their next impulse purchase.

Developing products requires a clear strategy, thinking about what the product will be, but also: Will you buy or build? In-house or offshore? How will you protect your intellectual property? How will you train models and ensure quality? What SLAs will you commit to? Will there be an API? How will you charge for your data products and services? How will you maintain a good quality of service in years two, three and beyond? How will your data products integrate into your ’traditional’ product offering and how will your new team of Data Scientists work with your existing web development teams?
Data as a Capability
How will the technology you use enable better products and encourage new ways of working?
Your data ambitions will live or die as a result of the technology you implement to support them. If you fail to plan ahead and you will end up with silos of data across different teams and departments, in a host of different systems, accessible to no one. Worthless. On the other hand, if you over-egg the pudding, diving into a vast data platform project, replete with cutting edge tech and buzzwords you will certainly over-spend, under deliver and make an enemy of whoever runs your finance department.

As a general rule, the tech should always follow the business need. Don’t invest in a vast data infrastructure until you legitimately need one. Resist the call of shiny things. Be pragmatic…
But…
It’s also true that good tech, accessible datasets, easy to use tools and an ability to add new things to your data lake quickly are all key enablers of a genuine data culture and solid data products. Businesses with good data tech stacks do good things with data!
Maintaining a balance requires strategic thinking, a clear roadmap and quality guardrails, deliberate actions and very clear rules of engagement for your data engineers.
Data as an Asset
How valuable is your data and how will you organise, share and secure it?
It is entirely possible that the data you collect and store about you customers, your product domain and your industry is your most valuable physical asset. Data, after all, is information. Knowledge. And knowledge is power. Your data contains insights your competitors do not have access to. It could be used to train your next recommender product, optimise the spend on your next ad campaign, validate an idea for a whole new product line. Your data is your competitive edge.
So how will you secure it? Who will have access to it? What would you do if it was leaked, deleted or stolen? What legal and regulatory responsibilities have you taken on by gathering it? What is your appetite for risk? Where do you draw the line on morality and ethics in your use of data?

Of course, if your data is valuable to you, it’s probably valuable to someone else too. Could you monetise your data assets? Is it a product in and of itself? How much are you willing to share and with whom?
Most importantly, how accessible is your data? Is it squirrelled away in proprietary formats that are difficult to query? Are the definitions of key measures clear and understood by everyone who uses them? Is a customer the same as a user, a session, an IP? Can you enumerate the different datasets you store? Can you find them? What teams, processes and governance will you put in place to ensure your data is accurate, up to date and easy to use?
Data as a Culture
How will you use data to better measure performance and communicate goals across your entire organisation?
It is a widely stated fact (albeit rarely supported by evidence) that data driven companies are more successful. Amazon springs to mind as an example of a place where data driven decisioning permeates everything; where decisions are made objectively, based on evidence, measurement and the proof (or otherwise) of a hypothesis. Other businesses operate on gut feel, using the knowledge and intuition of key people to lead the way: imagine any business led by Elon Musk! The truth is that neither of these is ‘right’ and neither is ‘wrong’ - the key thing is simply to know where you want to be and have a solid plan to get there.
Measuring as much as possible and building as many graphs, dashboards and charts as you can is not the way forward here. Instead, think about the way you run your business and how data can be used to drive the things that matter. What are your core KPIs? How do these ladder into departments, teams and individuals? Are OKRs the right way to run your business? How can you objectively measure the performance of different business areas - sales, fulfilment, manufacturing, marketing? What bad behaviours might a poorly selected measure encourage? Can you use data to define new product ideas, or simply to measure the impact of your own ideas, once they have been shipped?

Your data culture goes hand in hand with your culture as a company, it defines what it’s like to work for you, how success is measured, how goals are communicated. Successful data cultures start at the very top and need buy-in at all levels to become a success. Every meeting, process and update needs to be considered. Change will likely occur at glacial pace. Your strategy here captures your appetite to base the way you work on data-driven practices, as well as your plan to get there.
Healthy tension
As I said, each of these four areas is independent, and to some extend at odds with the other points of the compass. Each acts as an enabler or potentially adds constraints for the others. Everyone has their own natural bias towards one of the points (I was a data engineer for years, so I do have a soft spot for those capabilities!) and there’s a risk that if you attack your whole strategy in one big lump, your natural bias for one point of the compass might drown out legitimate concerns across the others. Let me give a couple of examples…

Example One: Differentiator vs Asset - While Data as an Asset is all about well structured, secure and governed data, Data as a Differentiator tends to play it a bit more fast and loose! Product teams are rightly under pressure to ship new features quickly and maximise the value to customers and the business - this can mean loading datasets ad-hoc from obscure locations, friction around regulation on the use of certain fields and so on. A good data strategy must acknowledge both the legitimate need to innovate fast and the need to manage data in a deliberate and well structured way. It’s also necessary to understand that a well defined data model may drive your product direction as strongly as any other factor.
Example Two: Capability vs Culture - There is overwhelming evidence to suggest that the world’s favourite tool for processing, storing and visualising data is Excel. Spreadsheets come with downsides that will turn the stomach of most data engineers, but they also come with significant benefits to data as a culture, foremost of which being an incredibly low barrier to entry. Data as a capability demands security, performance and consistency, and is right to do so, but the downside of most solutions is that they turn data access into a technocracy. Most people in most businesses don’t know SQL, won’t have access to git, Jira or your master data management system. Many will find even the best data exploration tools like Tableau and Looker to be more of a hinderance than a help. Again, a good strategy must call out these competing drivers and assert both the need for solid tech and easy access.
Opposing compass points have the highest level of tension, and though the above examples are perhaps a little trite, I hope they illustrate the theory behind this. Adjacent points on the compass may have some overlapping requirements, but should still be examined independently.
Example Three: Asset vs Culture - Analysts and data modellers work very closely and most analytics initiatives will involve creation of new core models as well as the marts and dashboards for presentation/investigation. There’s certainly overlap here. However, while data as a culture is about answering burning business questions with well executed analytics and reporting, data as an asset cares more about the general applicability, ownership and reliability of the models that lie at the heart of every answer. Lean too far towards culture and your core models will over-fit to one business use-case; conversely, if you lean too far towards your data assets, you’ll fail to answer questions quickly enough - opting for perfection over speed.
Example Four: Capability vs Differentiator - There’s a large skills overlap here too, with data engineers being involved in data platform and product development. Similar skills would be needed to build a Kafka-based streaming platform and to deploy a new recommendation algorithm onto that platform, for example. However, the motivations are very different. Data as a capability has highly generalised success factors - with emphasis being on moving and storing large volumes of any data. Data as a differentiator is all about product development, which requires a deep understanding of your customers, products and domain. Conflating these two technically similar but philosophically opposite compass points leads to damaging consequences.
Building a strategy
Defining a data strategy for an entire business can be daunting, so at the very least, the four points of the Data Compass form a set of jumping-off-points to get started. More than that though, and as I hope I’ve convinced you, they separate what I believe are four totally distinct focus areas, which have unique and often competing priorities and success factors. Each delivers value to the business in a different way, each demands a different mix of people and skills as well as a different level of investment. All four need to be kept in balance in order to succeed.

For each area, the same high level process can be followed, though you may find that it plays out very differently in each area!
How will you deliver value? thinking of both the long and short term, make sure you tie this back to wins you can achieve quickly, as well as long term aspirations. For example: “Target our marketing to improve campaign performance by 20%” (Differentiator), “Improve stock control and manufacturing lead times through increased visibility of the sales pipeline” (Culture), “Monetise our historical data via Amazon marketplace” (Asset).
People, roles and skills: identify the people you need in this area to be successful. Consider allies within your existing organisation as well as developing a hiring plan to fill gaps. Set up the meetings, working groups and accountabilities you need to achieve your goal. Involve these people in developing the strategy as well as enacting it!
Define your success measures: The best way to communicate a goal is a metric, after all! For example: “Platform can support collection of data from all 1M active users per day” (Capability); “All datasets added to data catalogue and owners tagged” (Asset); “All departments using Tableau for monthly business review” (Culture); “Time taken to add a new dataset to the data lake is less than a week” (Capability); “Conversion rate on social media campaigns improved by 10%” (Differentiator); “Subject access requests handled within two weeks or less” (Asset)
Define your guard rails: Draw the lines you are not willing to cross, to protect your business and your customers. For example: “Details of our ML algorithms and model hyper parameters and considered confidential intellectual property” (Differentiator); “No model should be trained using protected personal characteristics as an input” (Differentiator); “Data will always be encrypted at rest” (Capability); “Sensitive data will always be clearly labelled” (Asset)
Ways of working: Think about how you will embed data skills (analysts, DS, DE etc) into existing teams and processes. Will you work with a centralised, embedded or hybrid model creating a “centre of excellence”? Note that you don’t have to pick one pattern for all cases - in fact, this will almost certainly be different for each of the data compass areas. What works in data engineering will not be the same as what works for product development or analytics teams.
Roadmap, deliverables and artefacts: Finally, identify the jobs to be done and build a roadmap to deliver them. Base the style of your roadmap on your preference as a business - Kanban backlog, Gantt chart, milestones, OKRs… whatever gets the message across most effectively. The items on each of the four backlogs will be very different - ranging from new products to processes, documents and tools. You might find that there are some dependencies between the four compass areas, which brings us nicely to the final section of this blog…
Pulling it all together
The last job is to pull the four compass points back together, resolving any cross-cutting concerns and dependencies. This might seem daunting, but in practice often turns out to be simple enough, if you focus on the outcomes you’ve defined so far.

It’s very easy to fall into a false dependency trap: In order to improve our supply chain we need new dashboards. In order to build those dashboards we need data models in the warehouse. In order to model the data, we need raw source data to be ingested to the data lake. In order to get that data into the lake we need a data ingest platform. In order to build a data ingest platform, we need huge upfront data engineering investment!
This logical flow ends up devaluing any long term wins by gating them behind a sizeable up-front investment. This happens regularly. Rookie leaders use over-hyped long term benefits to justify excessive investment in tech, then jump ship when their ’next gen data platform’ turns out to be a white elephant. Cue the arrival of the next person, who blames this on the tech and repeats the process…
The logic that prompts this whole mess is simply not valid. In reality it’s possible to make huge steps forward on data governance, ways of working, product development and cultural drivers like OKRs and business metrics without investing a penny into the tech. You can catalogue, monetise and model data in your legacy databases, even in excel if you’re so inclined. You can train complex AI/ML products using manually collated datasets and little more than a python notebook. You can measure the performance of your business using metrics presented to you in powerpoint and worked out on a desktop calculator. Technology makes it easier to do all these things, but it’s not a prerequisite.
The secret sauce, of course, is the way you balance the investment between the four points of the data compass. Ensuring that you’re always moving forward in each area and constantly seeking to improve each one. Tradeoffs and compromises are always necessary, but if you are cognisant of data as a Differentiator, a Capability, an Asset and as a Culture, you will be very well placed to make the right choices and derive the maximum value from your most precious commodity.