Predicting MOT Pass Rates with Spark MLlib
June 23, 2016
Every car in the UK, once its’s three years old, need to have an MOT test annually to prove it’s safe to drive. The good people at the DVLA have made a large chunk of the data available as part of the government’s push to make more data “open”. You can all the code for this article in my GitHub.
Visualising the data
Before I started doing any machine learning, I did some basic visualisation of the data in a series of charts, just to get an idea of the “shape” of things. I used Spark to process the data (there’s lots of it) and D3js to create some charts. I haven’t been able to make the charts work in Wordpress yet but you can see them below as screenshots of elsewhere as a live document.
The data arrives in CSV format, which is very easy to digest but pretty slow when you’re dealing with tens of millions of rows. So the first thing I did was to transform the data to Parquet using Spark’s built in Parquet capabilities. This improved query performance massively.
Test counts over time
First thing to look at: how many tests are carried out on vehicles of a given age? Basically, how many 3-year-old, 4-year-old, 20-year-old… cars are on the road. The dataset contains records for MOTs on cars well over 100 years old, but there aren’t many of them.
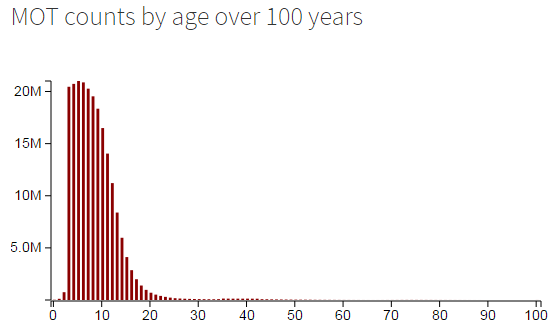
As you can see from the histogram, most tests are carried out on cars between 3 and 15ish years old.
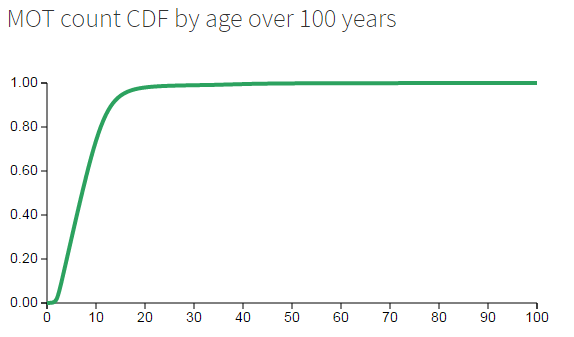
The accompanying CDF shows that the 95% percentile is roughly around the 15 year mark. Let’s zoom in a bit…
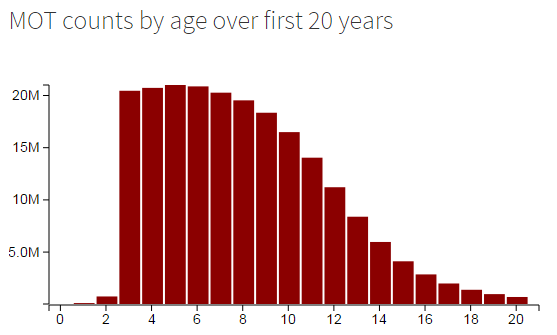
The zoomed-in histogram makes the 10-15 year shelf life of most cars pretty apparent.
Pass rates by age
Are people throwing away their older cars because they’re uncool or because they are broken?
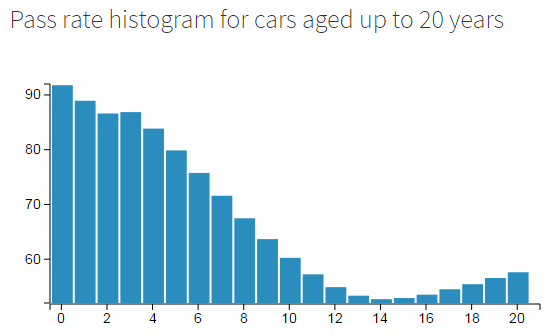
A look at the pass rate over time shows that it’s probably because they’re broken. The pass rate starts off pretty high - well over 85%, but dips top an all time low at 14 years of age.
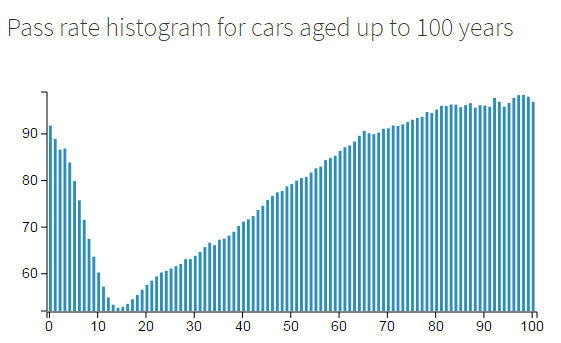
Once cars get past the 14 year “death zone” their prospects get better though. As cars get older and older the first-test pass rate heads back up towards 100%. At around 60 years old, cars have a better chance of passing their MOT than when they’re brand new!
I guess it’s safe to assume that cars over 30 years of age are treated with a little more respect. They’re “classics” after all. Once a car is 80+ years old it probably lives in a museum or private collection and drives very little throughout the year. The MOT test is much “easier” for older cars too - a 100 year old car does not have to pass emissions!
Manufacturers
The pass rate changes differently as cars from different manufacturers get older. Some manufacturers make “disposable” cars, some make cars designed to be classics the day they leave the showroom (Aston Martin, Lotus, Rolls Royce). Some make cheap cars that people care less about (Vauxhall, Ford), some make posh cars people take care of (Audi, BMW). Japanese manufacturers seem to be able to build cars with very steady pass rates over time.
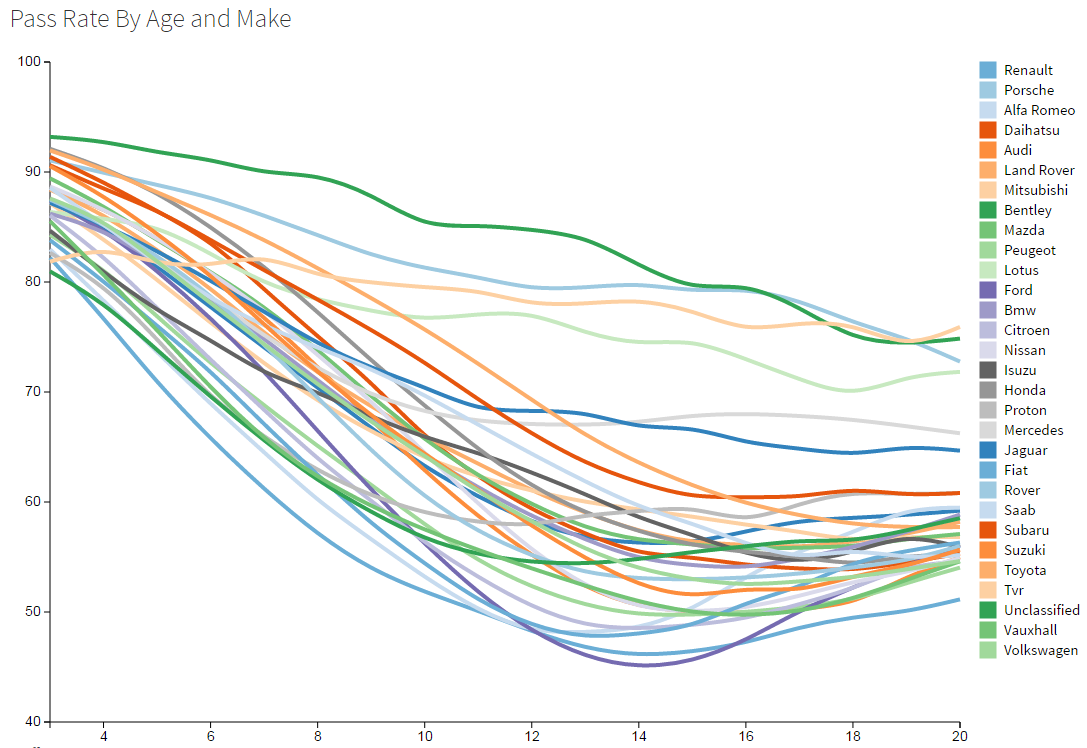
It might not be a shock that Bentley, Porche are at the top here, with TVR close behind. For me the biggest surprise was that Ford takes the deepest dip at the 14 year mark. Fords are clearly not built to last… or maybe people don’t care for them. Renault and Alpha Romeo join Ford at the bottom of the table here.
Numbers of cars
It’s all very well to be mean to Ford about their poor longevity, but they do have more cars on the road that pretty much anyone else. Check out the heatmap: 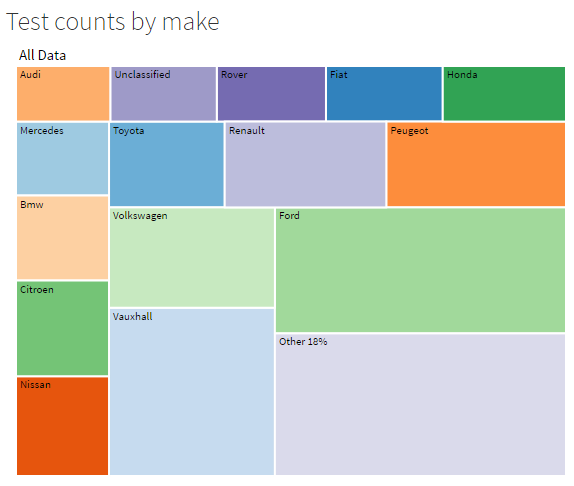
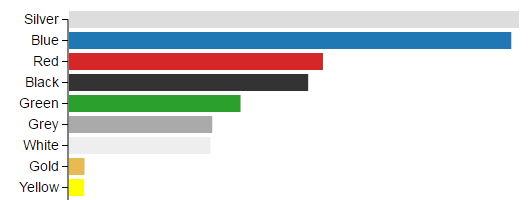
While we’re counting cars, it looks like silver is the most popular colour. The MOT test data “runs out” in 2013, so I’d expect to see a lot more white cars these days.
Some code
OK, so we’ve looked at some charts not let’s look at some code. All the charts about were generated by simple Spark dataframe apps, wrapped up in a unit test harness for ease of use. Here’s an example:
it should "calculate pass rate by age band and make" in {
val motTests = Spark.sqlContext.read.parquet(parquetData).toDF()
motTests.registerTempTable("mot_tests")
val results =
motTests
.filter("testClass like '4%'") // Cars, not buses, bikes etc
.filter("testType = 'N'") // only interested in the first test
.filter("firstUseDate <> 'NULL' and date <> 'NULL'")
.withColumn("passCount", passCodeToInt(col("testResult")))
.withColumn("age", testDateAndVehicleFirstRegDateToAge(col("date"), col("firstUseDate")))
.groupBy("age", "make")
.agg(count("*") as "cnt", sum("passCount") as "passCount")
.selectExpr("make", "age", "cnt", "passCount * 100 / cnt as rate")
.filter("cnt >= 1000")
.rdd
val resultMap =
results
.map({
x => (
x.getString(0),
x.getInt(1),
x.getLong(2),
x.getDouble(3)
)
})
val mappedResults =
resultMap
.groupBy { case (make, age, cnt, rate) => make }
.map { case (make, stuff) =>
AgeAndMakeResults(make,
stuff
.map { case (_, age, cnt, rate) => new RateByAge(age, cnt, rate) }
.filter(x => x.age >= 3 && x.age <= 20) .toSeq ) } .filter(_.series.length >= 18)
.collect()
JsonWriter.writeToFile(mappedResults, resultsPath + "passRateByAgeBandAndMake.json")
}
Not sure what else there is to say about the code. Have a read or hit my github if you want to play around with it!
Machine Learning: Predicting pass rate
Spark’s MLlib codes with all sorts of machine learning algorithms for predicting and classifying (mainly the latter) data. I looked at decision trees, random forests and neural networks for this. The idea was to turn some properties of a vehicle such as age, mileage, manufacturer, model, fuel type and so on into a pass/fail prediction.
It didn’t work! Yes, sorry, that’s right, it’s not really possible to predict a straight pass or fail. Even in the worst case, the first-test pass rate for all different classes of car is over 50%. Machine learning techniques being as they are, this means that the simplest solution for any predictive model is simply to predict a pass every time.
This happened with all three techniques - neural nets, decision trees and random forests all “learned” to predict a pass every time, giving them a 50-60-ish% accuracy. Darn it!
Predicting Pass Probability Classes
So, if you can’t predict two classes (“PASS” and “FAIL”) maybe its easier to predict Pass Probability Classes (50-60%, 60-70%, 70-80% etc). Well, yes it was slightly more successful, but not exactly stunning!
The best results I got were predicting 10 pass rate classes for each decile of probability. This gave me these rather lame results:
Mean Error: 1.1532896239958372 Precision: 0.3961880457753499
So the mean error is greater than 1 - i.e. most test data entries are classified over one class away from their true class. The precision shows only 40% of samples being predicted correctly. Pants.
The confusion matrix tells a slightly more positive story though - here it is rendered as a colour map:
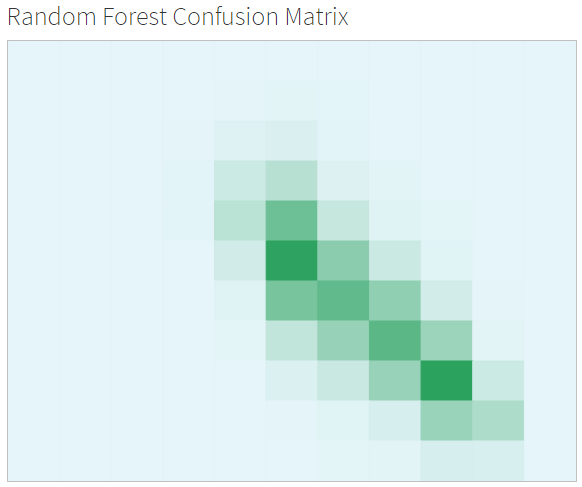
The confusion matrix shows the class predicted by the model (column) versus the actual class of the sample (row). A perfect predictor would give a diagonal green line from top left to bottom right, showing every class predicted correctly.
In this case, the random forest is attempting to predict the banded pass rate (0: 0% - 10%, 1: 10 - 20%, 2: 20 - 30%, … 9: 90% - 100%). Since virtually no classes of vehicle exist where the pass rate is less than 40% it doesn’t do very well at those levels, however, from 40% to 80% it does pretty well.
Some More Code
The code is complex - Spark makes it easy to run machine learning algorithms, but there’s a lot of bits and bobs round the edges like UDFs and utility functions. The following listing is the algorithm which gave me the results above (my best attempt). Hit the githib link at the top of this page if you want to dig further into the code.
it should "use a decision tree to classify probability classes" in {
    val motTests = Spark.sqlContext.read.parquet(parquetData).toDF()
    motTests.registerTempTable("mot_tests")

    val keyFields = Seq("make", "colour", "mileageBand", "cylinderCapacity", "age", "isPetrol", "isDiesel")

    // Get the distinct values for category fields
    val distinctCategoryValues = Seq("make", "colour")
      .map(fieldName => (fieldName, motTests.select(col(fieldName)).distinct().map(_.getString(0)).collect().toList)).toMap

    // A UDF to convert a text field into an integer index
    // Should probably do this before the Parquet file is written
    val indexInValues = udf((key : String, item : String) => distinctCategoryValues(key).indexOf(item))

    val data =
      motTests
        .filter("testClass like '4%'") // Cars, not buses, bikes etc
        .filter("firstUseDate <> 'NULL' and date <> 'NULL'") // Must be able to calculate age
        .filter("testMileage > 0") // ignore tests where no mileage reported
        .filter("testType = 'N'") // only interested in the first test
        .withColumn("testPassed", passCodeToInt(col("testResult")))
        .withColumn("age", testDateAndVehicleFirstRegDateToAge(col("date"), col("firstUseDate")))
        .withColumn("isPetrol", valueToOneOrZero(lit("P"), col("fuelType")))
        .withColumn("isDiesel", valueToOneOrZero(lit("D"), col("fuelType")))
        .withColumn("mileageBand", mileageToBand(col("testMileage")))
        .groupBy(keyFields.map(col): _*)
        .agg(count("*") as "cnt", sum("testPassed") as "passCount")
        .filter("cnt > 10")
        .withColumn("passRateCategory", passRateToCategory(col("cnt"), col("passCount")))
        .withColumn("make", indexInValues(lit("make"), col("make")))
        .withColumn("colour", indexInValues(lit("colour"), col("colour")))
        .selectExpr((keyFields :+ "passRateCategory").map(x => s"cast($x as double) $x"):_*)
        .cache()

    data.printSchema()

    val labeledPoints = toFeatures(data, "passRateCategory", keyFields)

    labeledPoints.take(10).foreach(println)

    val Array(trainingData, testData, validationData) = labeledPoints.randomSplit(Array(0.8, 0.1, 0.1))
    trainingData.cache()
    testData.cache()
    validationData.cache()

    trainingData.take(10).foreach(println)

    val categoryMap = Seq("make", "colour").map(field => {
      ( data.columns.indexOf(field), distinctCategoryValues(field).length )
    }).toMap

    val model = RandomForest.trainClassifier(trainingData, 11, categoryMap, 20, "auto", "gini", 8, 500)

    val predictionsAndLabels = validationData.map(row => (model.predict(row.features), row.label))
    predictionsAndLabels.take(10).foreach(println)
    val metrics = new MulticlassMetrics(predictionsAndLabels)

    val error = math.sqrt(predictionsAndLabels.map({ case (v, p) => math.pow(v - p, 2)}).sum() / predictionsAndLabels.count())
    println(s"Mean Error: $error")
    println(s"Precision: ${metrics.precision}")

    println("Confusion Matrix")
    println(metrics.confusionMatrix)

    CsvWriter.writeMatrixToFile(metrics.confusionMatrix, resultsPath + "decision-tree-probability-classes-confusion-matrix.csv")

    for(x <- 0 to 10) {
      println(s"Class: $x, Precision: ${metrics.precision(x)}, Recall: ${metrics.recall(x)}")
    }
  }
Conclusions
I think I proved that MLlib and Spark are a great choice for writing machine learning algorithms very quickly and with very little knowledge.
I think I also proved that Data Scientists need to know a hell of a lot more than how to fire up a random forest. I know a little bit about data and machine learning (thus the name of this website!) but in order to make much sense of a dataset like this you need a whole arsenal of tricks up your sleeve.
As usual, D3.js and AngularJS are great.