Mapserver and Leaflet
June 18, 2014
Leaflet
Leaflet is a very simple but incredibly powerful Javascript mapping library that lets you add interactive maps to your website very easily. Try scrolling and zooming around this one:
For example, to add that map to this page, all I did was add the following code (after reading the Quick-Start Guide):
<link rel="stylesheet" href="http://cdn.leafletjs.com/leaflet-0.7.3/leaflet.css" />
<script type="text/javascript" src="http://cdn.leafletjs.com/leaflet-0.7.3/leaflet.js"></script>
<script type="text/javascript">
var map = L.map('danMap').setView([51.4, -1.25], 13);
L.tileLayer('http://{s}.tiles.mapbox.com/v3/YOUR.MAP.KEY/{z}/{x}/{y}.png',
{
attribution: 'Map data &copy; <a href="http://mapbox.com">Mapbox</a>',
maxZoom: 18,
}).addTo(map);
</script>
You can add points, polygons and visualise all kinds of live data using a simple web service that returns some GeoJson data. It works like a charm on mobile devices too!
Why combine Leaflet with Mapserver?
I have a couple of use-cases that meant I needed to look at combining Leaflet with Mapserver. This turns out to be easy enough as Leaflet can hook up to any tile provider and Mapserver can be set up to serve images as a Web Map Service (WMS).
The first thing I wanted to do is serve up some map data when not connected to the internet. Imagine I am in the middle of nowhere, connected to the Raspberry Pi in the back of the Land Rover via WiFi to my phone or tablet. I have a GPS signal but I don’t have any connection to a map imagery server as there’s no mobile coverage. I need to use mapserver to render some local map data so I can see where I am. This use case has a boring work-related benefit too - it enables you to serve up maps in a web-based mapping application behind a strict corporate firewall.
The other use case is simple: raster data. Lots of the data we deal with where I work is served up as raster data by Mapserver. Imagine it as heat-maps of some KPI value layered on top of a street map.
Setting up Mapserver
There are a couple of things you need to do to EPSG 3857. Make sure you use that EPSG at the root of your map file.
[sourcecode] PROJECTION “init=epsg:3857” END
WEB METADATA “wms_title” “Dans Layers and Stuff” “wms_onlineresource” “http://192.168.2.164/cgi-bin/mapserv.exe?” “wms_enable_request” “*” “wms_srs” “EPSG:3857” “wms_feature_info_mime_type” “text/html” “wms_format” “image/png” END END[/sourcecode]
The next thing to do is add some extra stuff to every layer in your map. You need to set the STATUS field to ‘on’; add a METADATA element and set the ‘wms_title’ to something sensible; and finally add a projection, specifying the projection the layer data is stored in. As I am using the OS VectorMap District dataset, which is on the OSGB projection I used EPSG 27700.
[sourcecode] LAYER NAME Woodland DATA Woodland PROJECTION “init=epsg:27700” END METADATA “wms_title” “Woodland” END STATUS on TYPE POLYGON CLASS STYLE COLOR 20 40 20 END END END [/sourcecode]
Connecting it Together
You can then add a new layer to the Leaflet map, connected to your Mapserver. Here I’m using ms4w, the Windows version of Mapserver and hooking it up to a map file in my Dropbox folder. The map file I am using is the one I created for a previous post on mapserver.
L.tileLayer.wms("http://localhost:8001/cgi-bin/mapserv.exe?map=D:\\Dropbox\\Data\\Mapfiles\\leaflet.map", {
			layers: 'Roads,MotorwayJunctions',
			format: 'image/png',
			transparent: true,
			attribution: "Dan's Amazing Roads",
			maxZoom: 18,
			minZoom: 12,
		}).addTo(map);
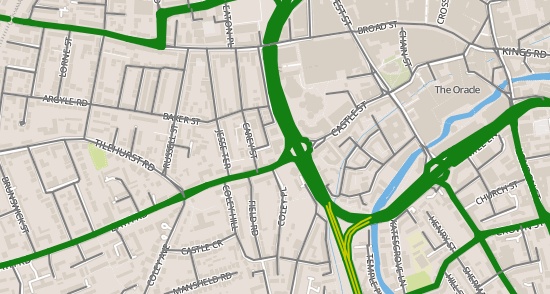
Sadly I don’t have a mapserver instance on the internet, so all I can show here is a couple of screenshots. You’ll just have to take my word for it - it works brilliantly!