Economy Investigation
Apart from a few speedo related problems I’ve had a pretty great first few days driving around in The Duke. The engine has enough grunt and nothing has fallen off yet (OK, the idle screw fell off the carb, but that’s not too terrible). The gearbox seems to be OK, though there are a few problems selecting first and second when at a standstill, but that might just be driver inexperience!
The biggest problem I have is top speed and fuel economy. On the flat, with a bit of a tailwind and the gas pedal mashed into the floor the speed slowly creeps up to about 55 MPH. Not an ideal top speed for motorway travel and when the speed passes 50 the engine is already screaming; well out of its peak power rev range and generally out of puff.
This has me thinking that what The Duke needs is higher gearing. Not only would this give me a more respectable top speed but also much better fuel economy on longer runs.
The two options are an what is the best solution.
Anyway, in the run up to these changes I thought I’d try and get an idea of how good the fuel economy is at the moment. After about 80 miles of driving I went to the petrol station and filled the tank back up. It cost £30 for 27.5 litres of petrol, which works out at just under 10 miles per gallon. Not great, but plenty of room for improvement.
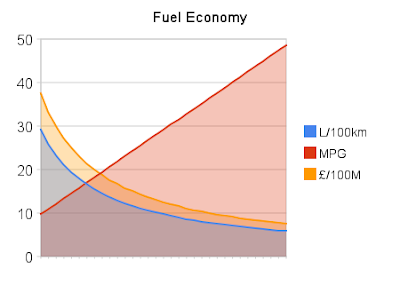
10MPG is an interesting figure in that it doesn’t obviously mean much. A bit of research and I found an interesting website which claims that MPG gives a biased indication of how good a vehicle actually is. In order to prove the point to myself I knocked up a little graph…
 The X axis corresponds to the number of miles I might get for my £30 worth of petrol - the rather pathetic 80 miles that The Duke managed this week is at the far left and on the far right is the dizzying dream-figure of 400 miles which Marvin the Mondeo would probably manage on a motorway run. The number of miles you can get out of a fixed quantity of fuel is a good indication of how efficient your engine is.
The lines on the graph correspond to MPG, Litres per 100km (which is a common fuel economy measurement) and pounds per 100 miles (a figure that’s really easy to think about as a British motorist).
The thing that really stands out in the graph is that as cost decreases, MPG goes up. It doesn’t take a genius to deal with that but there’s something else odd too - MPG is clearly linear but the decrease in cost is not. Using a measure like L/100km or £/100 miles gives a better indication of the improvement than using MPG. After all, what I really care about is how much it will cost me to drive to Bristol and back.
Using the graph, it’s interesting to see that getting The Duke from 10MPG to 15MPG will save me around £15 per 100 miles. Getting him from 15MPG to 20MPG will only save me a further £4 per 100 miles. The same applies to The Duke’s nasty carbon emissions: a small change to MPG makes a big difference to the evil he squirts out of his exhaust pipe. What I’m basically saying is that the cost benefit of an improvement in efficiency is not directly proportional to the magnitude of the improvement. Getting an extra mile per gallon from The Duke is massively more important than getting 1MPG extra from a brand new Mini.
Anyway, now I have some baseline data to work with I can see what effect any changes I make have had on the cost of driving The Duke around. Watch this space!