A Trip To Work
I don’t drive The Duke that often because it’d cost a fortune and make me deaf. So to test his new GPS powered brain I have been collecting test data in Vinny the Vectra. I can then use this data to write some unit tests and develop cool stuff while stationary.
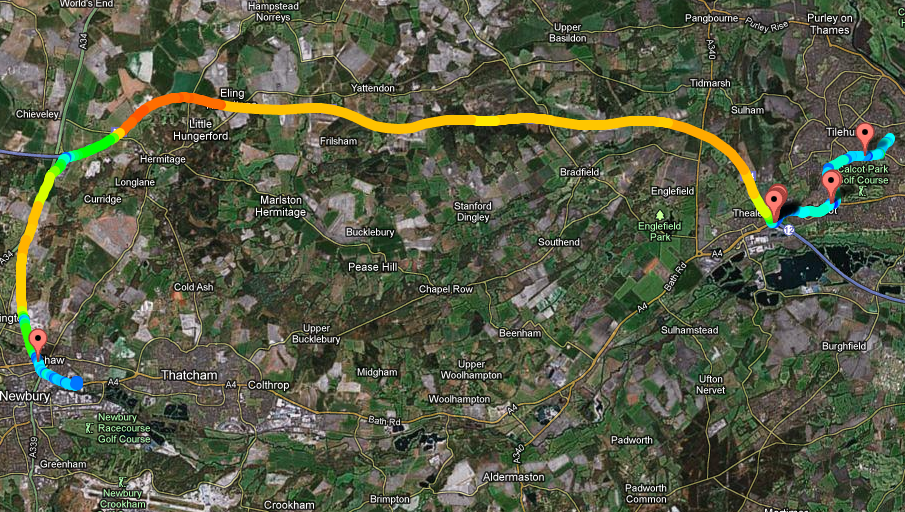
In a slack moment at work today I knocked up a couple of functions to detect traffic jams and visualise my speed on my way to work. Here’s a typical trip. Click on the pic or here to explore the interactive “report”.
I quite like these static pages for output. They are very simple to create with some code and can be pushed up onto the web easily. No faffing about with databases, just some HTML and Javascript. On the map above the placemarks show places where I stopped for more than 30 seconds (there was traffic at junction 12 that morning!) and the colour of the line shows my speed. In the end I’d like to detect more events - when we go off road, when I brake suddenly or go round a corner too fast, when we get stuck in a traffic jam and when we visit places we know. I also got the webcam working on the raspberry pi, along with a wireless internet dongle so I can embed photos and videos then upload live and post on twitter.
Here’s some code snippets. I’m just playing, so please don’t think of me as somebody who’d ever return an “Enumerable Of Enumerables” in production code! First is the function which splits the list of speed measurements based on bands of 10MPH…
        private IEnumerable<IEnumerable<GpsMeasurement>> SplitRouteBySpeed(IEnumerable route)
        {
            var bandedMeasurements = (from measurement in route
                                      select new { Band = (int) (measurement.GroundSpeedMph/10), Measurement = measurement }).ToList();

            int currentBand = int.MaxValue;
            List currentSection = new List();

            foreach (var bm in bandedMeasurements)
            {
                if(bm.Band != currentBand)
                {
                    currentBand = bm.Band;
                    if (currentSection.Count > 0)
                    {
                        currentSection.Add(bm.Measurement);
                        yield return currentSection;
                    }

                    currentSection = new List();
                }

                currentSection.Add(bm.Measurement);
            }
        }
Second is based on somebody else’s hard work really, but I changed it enough to make it worth posting here. I’m basically using speed as a percentage, squishing to a value between -1 and 1 then using four colour “axis” as beautifully described in the comment-linked blog.
        private string SpeedToColour(double groundSpeedMph)
        {
            // Based on this post - which has a very cool image to show what we're doing.
            // http://slged.blogspot.co.uk/2007/03/heat-map-code-snippet.html

            double fraction = (groundSpeedMph
            double red, green, blue;

            if ( fraction < -0.5 )
            {
                red = 0.0;
                green = 2*(fraction + 1);
                blue = 1.0;
            }
            else if ( fraction < 0 )
            {
                red = 0.0;
                green = 1.0;
                blue = 1.0 - 2.0*(fraction + 0.5);
            }
            else if ( fraction < 0.5 )
            {
                red = 2.0*fraction;
                green = 1.0;
                blue = 0.0;
            }
            else
            {
                red = 1.0;
                green = 1.0 - 2.0*(fraction - 0.5);
                blue = 0.0;
            }

            byte redByte = (byte) (255 * red);
            byte greenByte = (byte) (255 * green);
            byte blueByte = (byte) (255 * blue);

            return string.Format("#{0}{1}{2}", redByte.ToString("x2"), greenByte.ToString("x2"), blueByte.ToString("x2"));
        }
